Metrics
Scraping kube-router metrics with Prometheus
The scope of this document is to describe how to setup the annotations needed for Prometheus to use Kubernetes SD to discover & scrape kube-router pods.
For help with installing Prometheus please see their docs
Metrics options:
--metrics-path        string               Path to serve Prometheus metrics on ( default: /metrics )
--metrics-port        uint16 <0-65535>     Prometheus metrics port to use ( default: 0, disabled )
To enable kube-router metrics, start kube-router with --metrics-port and provide a port over 0
Metrics is generally exported at the same rate as the sync period for each service. Service metrics are exported real-time.
The default values unless otherwise specified are
- iptables-sync-period -
5 min - routes-sync-period -
5 min
By enabling Kubernetes SD in your Prometheus configuration & adding the required annotations, Prometheus can automatically discover & scrape kube-router metrics.
Available metrics
If metrics is enabled only services that are running have their metrics exposed
The following metrics are exposed by kube-router prefixed by kube_router_
Always enabled
- build_info Expose version and other build information (labels: goversion, version)
--run-router=true
- bgp_peer_info BGP peer information: address, state, and type (internal for iBGP and external for eBGP) (labels: address, type, asn, state)
- controller_bgp_advertisements_received Total number of BGP advertisements received since kube-router started
- controller_bgp_advertisements_sent Total number of BGP advertisements sent since kube-router started (labels: type)
- controller_bgp_internal_peers_sync_time Time it took for the BGP internal peer sync loop to complete
- controller_routes_sync_time Time it took for controller to sync routes
- host_routes_sync_time Time it took for the host routes controller to sync to the system
- host_routes_synced Count of host routes currently synced to the system
- host_routes_added Total count of host routes added to the system
- host_routes_removed Total count of host routes removed from the system
--run-firewall=true
- controller_iptables_sync_time Time it took for the iptables sync loop to complete
- controller_iptables_v4_save_time Time it took controller to save IPv4 rules
- controller_iptables_v6_save_time Time it took for controller to save IPv6 rules
- controller_iptables_v4_restore_time Time it took for controller to restore IPv4 rules
- controller_iptables_v6_restore_time Time it took for controller to restore IPv6 rules
- controller_policy_chains_sync_time Time it took for controller to sync policy chains
- controller_policy_ipset_v4_restore_time Time it took for controller to restore IPv4 ipsets
- controller_policy_ipset_v6_restore_time Time it took for controller to restore IPv6 ipsets
- controller_policy_chains Active policy chains (gauge)
- controller_policy_ipsets Active policy ipsets (gauge)
--run-service-proxy=true
- controller_ipvs_services_sync_time Time it took for the ipvs sync loop to complete
- controller_ipvs_services The number of ipvs services in the instance
- controller_ipvs_metrics_export_time The time it took to run the metrics export for IPVS services
- service_total_connections Total connections made to the service since creation
- service_packets_in Total incoming packets
- service_packets_out Total outgoing packets
- service_bytes_in Total incoming bytes
- service_bytes_out Total outgoing bytes
- service_pps_in Incoming packets per second
- service_pps_out Outgoing packets per second
- service_cps Service connections per second
- service_bps_in Incoming bytes per second
- service_bps_out Outgoing bytes per second
To get a grouped list of CPS for each service a Prometheus query could look like this e.g:
sum(kube_router_service_cps) by (svc_namespace, service_name)
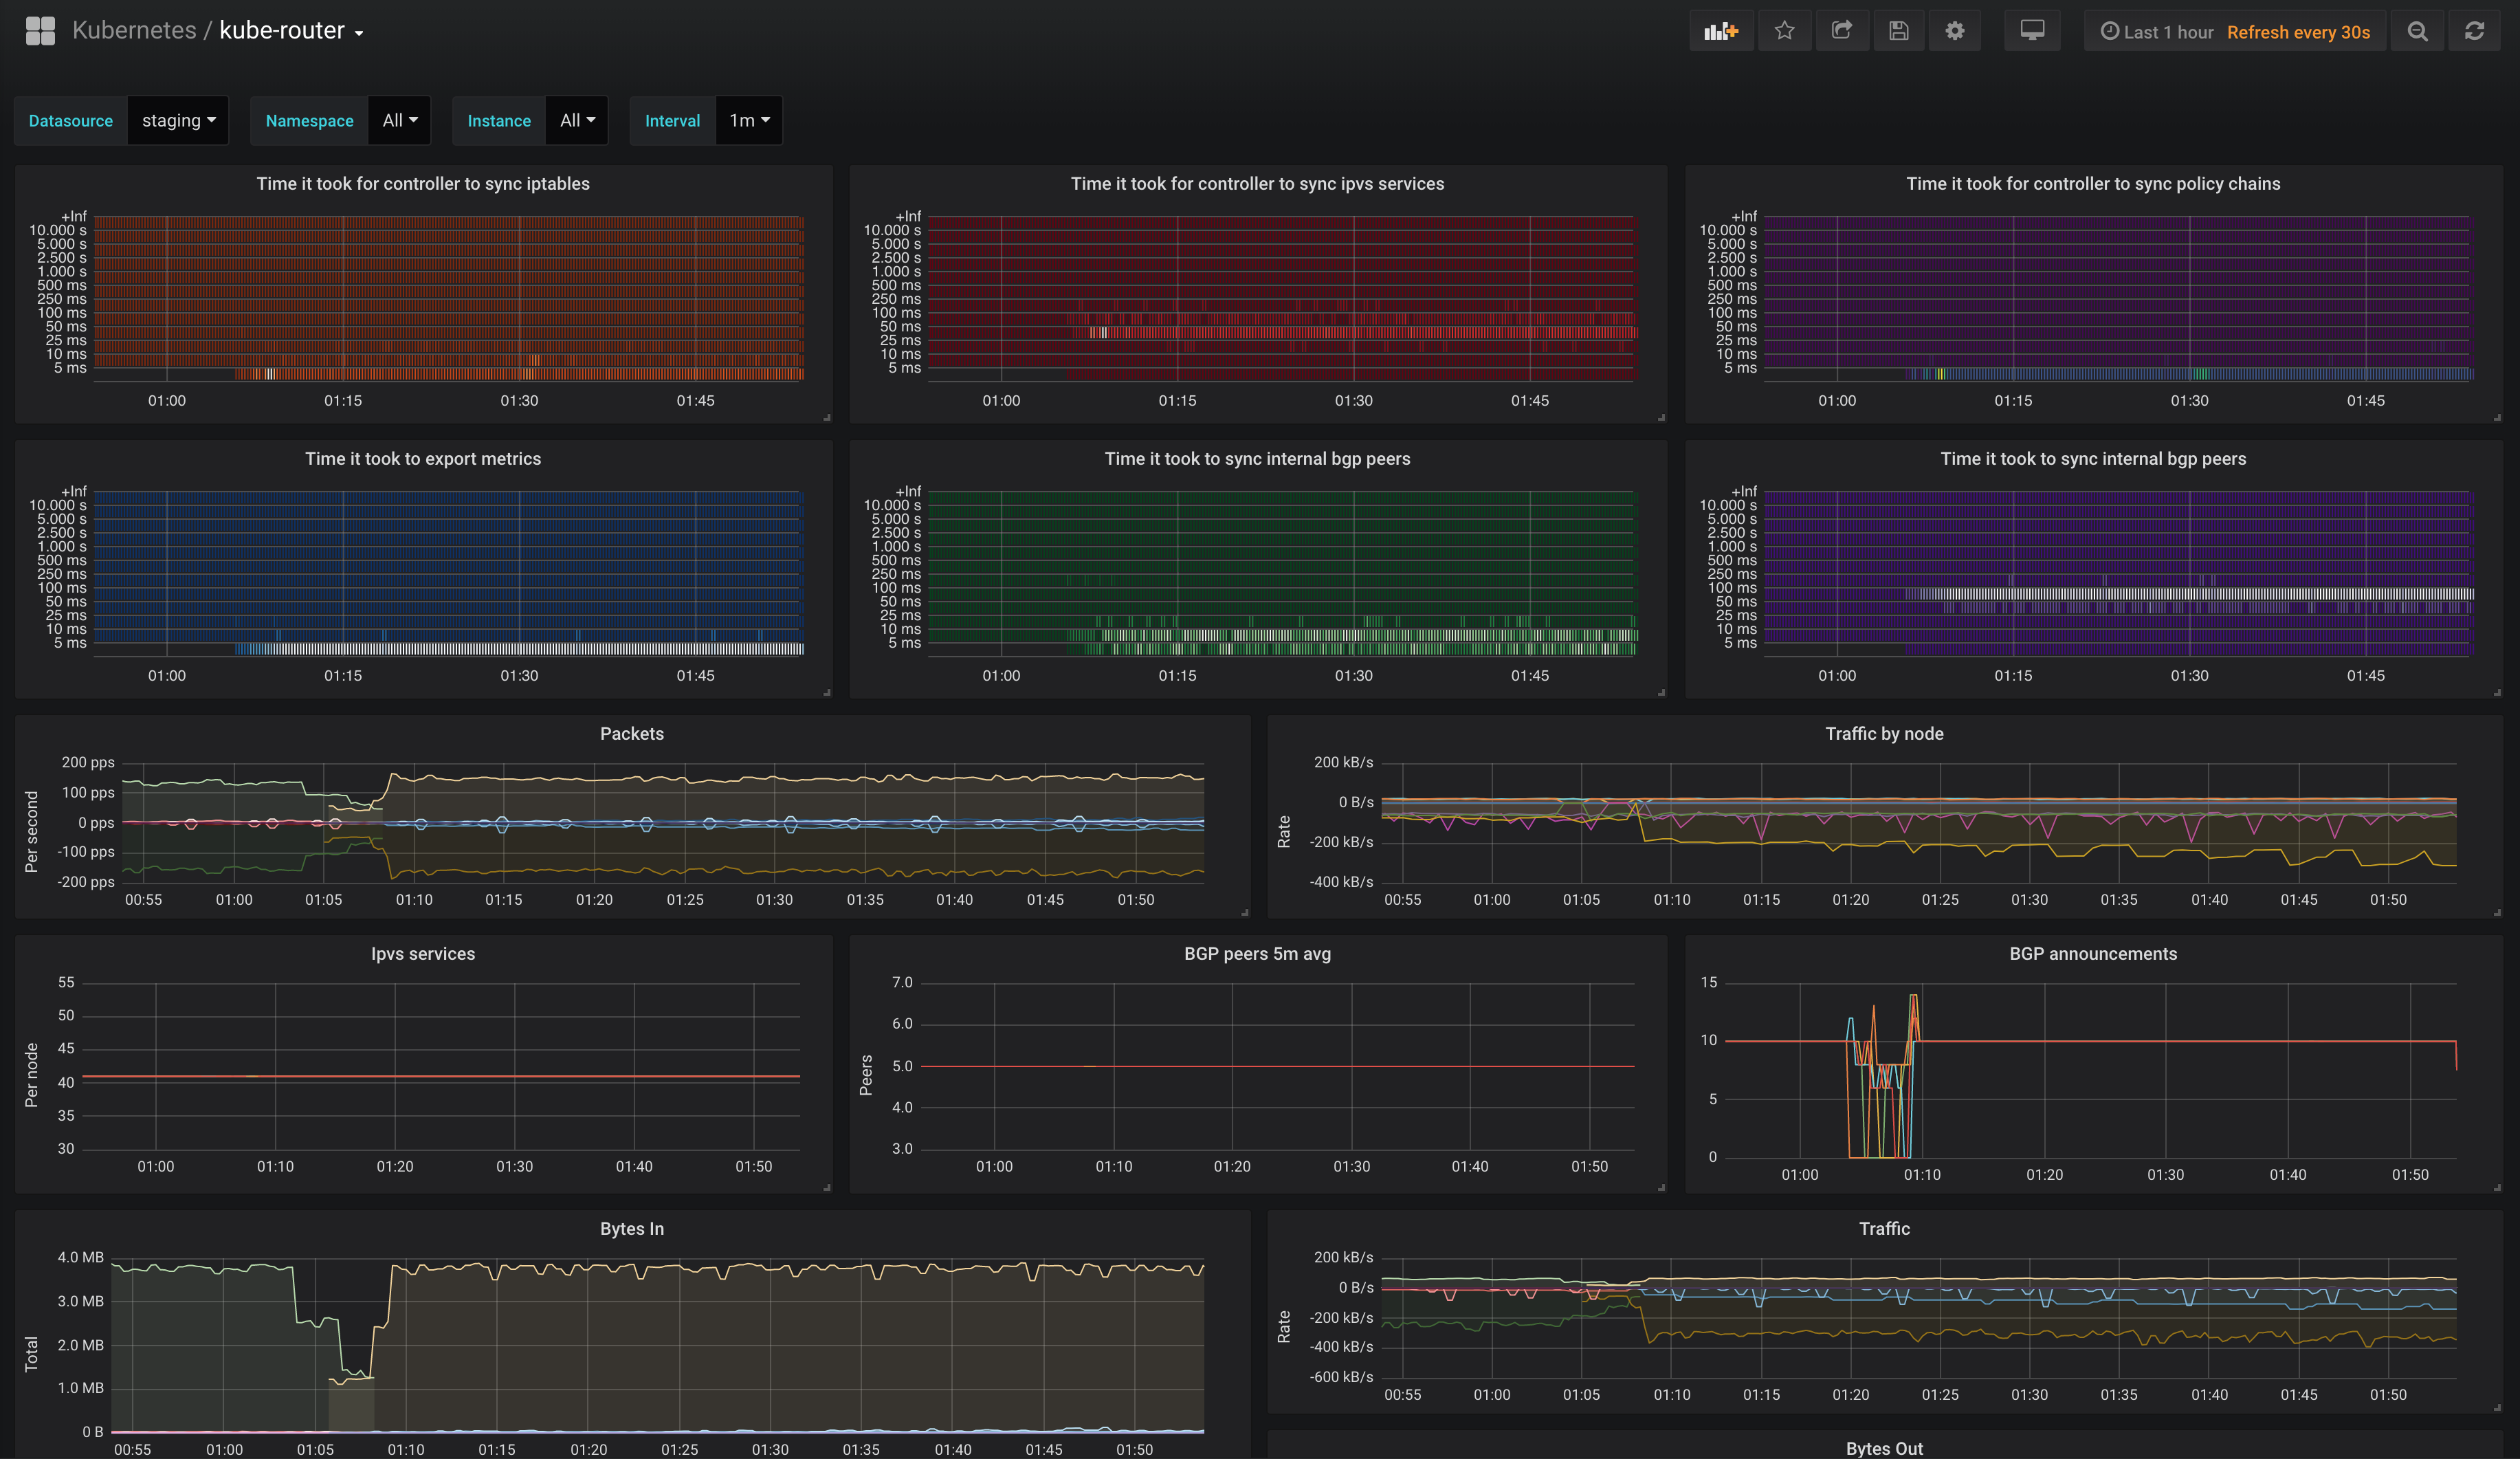
Grafana Dashboard
This repo contains an example
Grafana dashboard
utilizing all the above exposed metrics from kube-router.